SALARIES
National
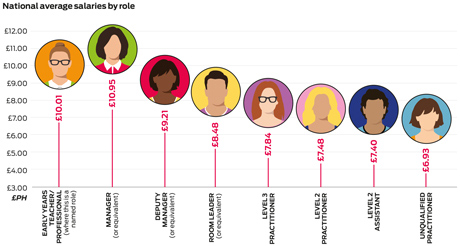
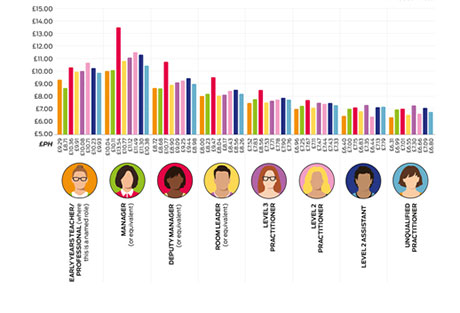
National average hourly wages ranged from £10.95 for managers (or equivalent) to £6.93 for unqualified practitioners, all significantly less than the average wage across all sectors in the UK of £13.50 per hour (source: Office of National Statistics, 2015).
This is unsurprising given that the early years is known to be a low-paid sector, as recognised by the Low Pay Commission (LPC) in its 2016 Spring Report, which said the national minimum wage (its value relative to typical sector salaries) was 84.8 per cent in the early years, higher than in social care (79.5 per cent) and retail (79.1 per cent), and much higher than the 54.1 per cent average for all sectors.
Notably, our survey also revealed that, on average, early years teachers/professionals earn just £10.01 per hour, less than half the median hourly wage of qualified teaching and educational professionals (£21.97 per hour).
The survey also indicates that there has been a stagnation in wages. The most recent Department for Education Childcare and early years providers survey, conducted in 2013, put hourly senior staff wages at £11.20 and £10.80 for full day care and sessional provision respectively; supervisory roles were paid £8.40/£8.70, and other roles £6.80/£7.30 respectively. These are similar wage levels to those reported by our survey, despite the fact that during this time the national minimum wage increased from £6.31 to £6.70 per hour, alongside the introduction of the national living wage (£7.20 per hour).
This suggests that, rather than sector salaries rising at the same rate as the national minimum wage, the gap between average wages and the minimum wage is shrinking. This is supported by the findings of the LPC’s Spring Report, which noted that the proportion of early years practitioners paid the minimum wage rose from 11.1 per cent in 2015 to 21.5 per cent in 2016, predicting a further increase to 39.3 per cent by 2020.
Again, this is not surprising given that early years funding has not risen in line with inflation or statutory wage increases in recent years.
Regional
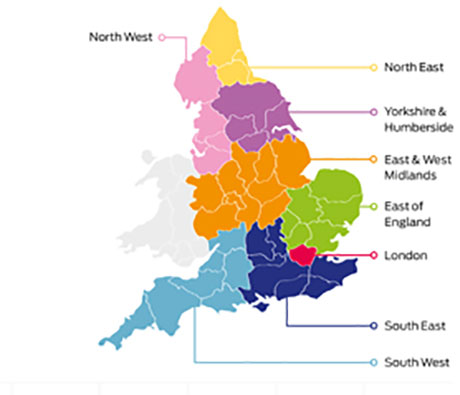
As would be expected, the survey found that wages are generally highest in London, with managers earning, on average, £13.54 per hour (compared with £10.04 in the East and West Midlands, the lowest regional rate), reflecting the higher cost of living – and higher funding rates – in the area. Salaries in the South East (£11.30 per hour for managers), though significantly less than those in London, are also among the highest, as would be expected given that the ONS ranks the region second nationally in terms of both salaries and living costs.
What is surprising, however, is that our survey found that wages in the North West were also among the highest – often higher, even, than those in the South East. This is despite the fact that the ONS ranks the area as having lower than average regional earning and living costs. These results may have been somewhat skewed by the fact that only a very small number of respondents (29) were based in the North West, meaning that the average rate was more susceptible to outliers.
Providers in Yorkshire and Humberside also reported relatively high wage rates – the fourth-highest overall, despite the fact that the ONS ranks the region as second to lowest in terms of average earnings and living costs.
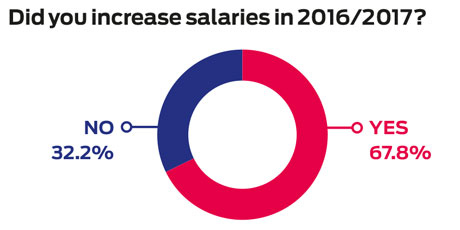
Adherence to the national living/minimum wage was by far the most commonly cited reason for increasing salaries, chosen by nearly three-quarters (72.9 per cent) of respondents.
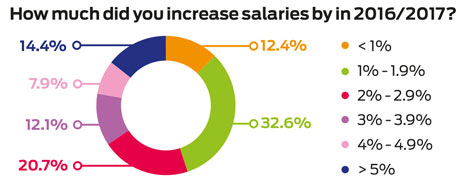
Most respondents have increased salaries by less than 3 per cent, with the majority in the 1-1.9 per cent bracket. Again, it is likely that a significant proportion of these incremental increases were adherence to the minimum wage, though it’s worth noting that these figures are in line with the wider economy, with pay increases in 2016/17 previously forecast to be around 1.7 per cent on average (source: Chartered Institute for Personnel and Development, 2016).
More surprising is the fact that 14.4 per cent of respondents increased pay by more than 5 per cent this year. It could be that this is part of a staff recruitment and retention strategy for those providers that can afford to do so, although it is important to remember that introduction of the national living wage in 2016 meant wage increases of more than 7 per cent for anyone over 25 who was previously being paid the minimum wage (£6.70 to £7.20). This may have forced some providers to raise wages quite significantly.

Hours worked
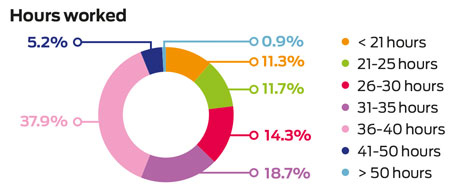
In all areas, the average hours worked per week most commonly fell within the 36- to 40-hour category, which aligns with the national average across sectors of 39.1 hours, as reported by the ONS. A very small number of respondents reported an unusually high number of hours worked per week (more than 50), though it is possible that some respondents included unpaid, ‘unofficial’ working hours (a survey conducted by the education union Voice last year found that nearly half of respondents regularly work more than their contracted hours for free).
TRAINING
Level 3 and above practitioners were widely identified as the staff members most likely to be offered both in-house and local authority training, with 86.1 per cent and 92.5 per cent (respectively) of respondents stating that they offer this, reflecting a strong sector commitment to professional development. Given the cost associated with training (whether internal or external), it is also unsurprising that a high proportion of respondents look to update senior staff (i.e. manager and deputy manager) knowledge as a priority, mostly likely with a view that they will then share this learning with their teams.

BENEFITS
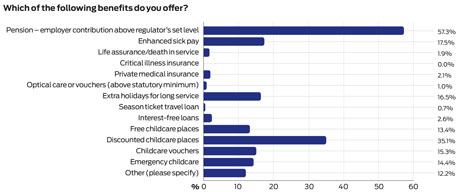
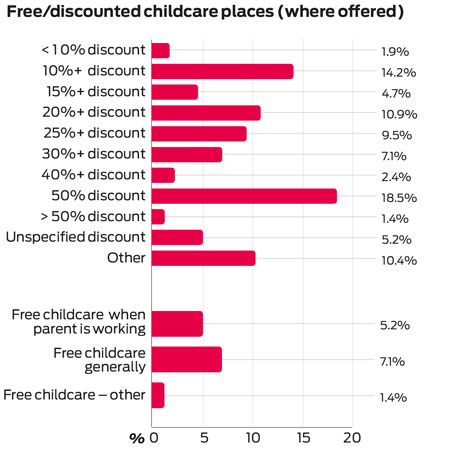
Pensions were the most commonly cited benefit; the second most cited benefit – discounted childcare places (35.1 per cent) – is likely to be a recruitment and retention tool as a sizable number of staff will have their own childcare requirements.
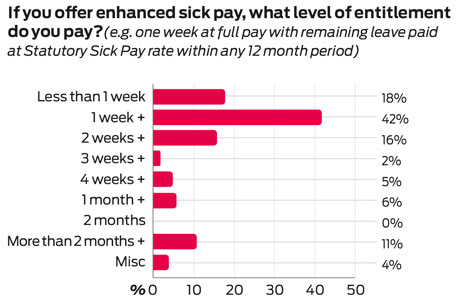
The level of enhanced sick pay varies, as would be expected given that any enhancement above the statutory rate is at the discretion of the employer, though one week at full pay was the approach cited most commonly.

Responses to the question on annual leave allowance varied quite considerably, with many seeming to state that they provide less than the statutory requirement of 28 days a year, suggesting that they did not include bank holidays in this figure. Overall, however, respondents most commonly cited 28 days or 20 days, suggesting that most providers offer the statutory minimum level of leave (excluding or including bank holidays).
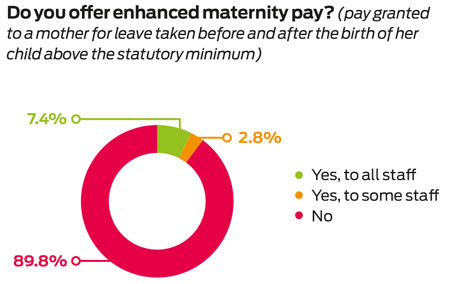
Few respondents (10.2 per cent) offer enhanced maternity pay, again a reflection of the cost pressures providers are facing, which means the benefits they are able to provide above and beyond the statutory minimums are limited. Only 6.1 per cent of respondents offer enhanced paternity pay, even less than the proportion (7.2 per cent) that offer enhanced pay for shared parental leave – a reflection of the historically low proportion of men in the sector.
Just under half (46.9 per cent) offer paid dependency leave (time off work to manage unexpected or sudden problems relating to a dependant) to employees. Although dependency leave is a statutory right, it does not have to be paid, and so it’s unsurprising that many of those respondents who offer a set amount of paid leave limit this to five days (i.e. a working week) at most. A notable proportion of respondents (20 per cent) said that the amount of paid dependency leave granted varies, although such an approach could leave them vulnerable to claims of discrimination if there is inconsistency.
RECRUITMENT
Just over half of survey respondents (51.5 per cent) reported recruitment challenges over the past 12 months, with a lack of applications received most commonly cited as the reason. This could reflect the impact of the EYE GCSE requirement, which has resulted in a sharp drop in practitioners completing Level 3 courses, although the sizeable disparities in salaries and benefits among providers could also explain why some providers are finding it more challenging than others to recruit staff (given that 48.5 per cent said they have not experienced recruitment difficulties in the past year).
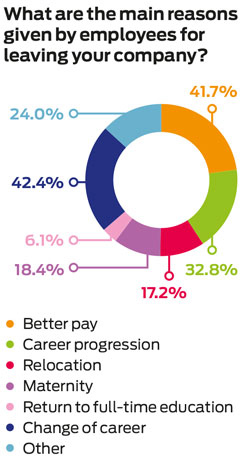
Given the generally low levels of pay in the sector, it is not surprising that change of career was the most commonly cited reason for staff resignations (42.4 per cent) followed closely by better pay (41.7 per cent). The fact that career progression (32.8 per cent) is the third most cited reason for resignations could reflect the fact that staff turnover for more senior early years roles is generally low (as is our experience at the Alliance), meaning that it can be hard for junior staff to progress within a provision, an issue further exacerbated by GCSE requirements hampering progression to Level 3.
STAFF PROFILE
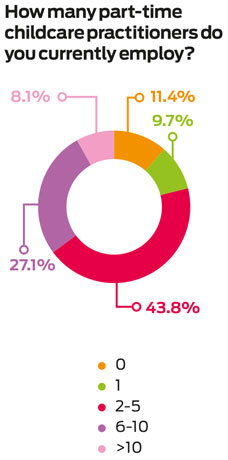
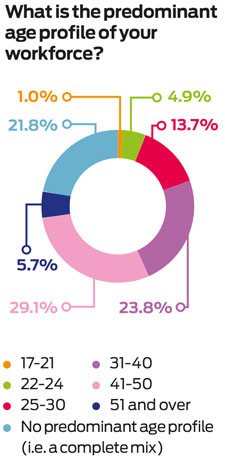
Survey respondents generally employ practitioners who are female (83.6 per cent employ no men at all), aged between 31 and 50. Part-time workers are prevalent in the sector, with over a third of respondents (35.2 per cent) employing more than six part-time employees, while a further 43.8 per cent employ between two and five.
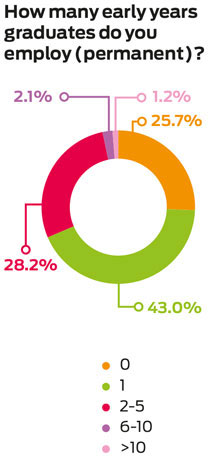
The majority of respondents employ at least one graduate, with only a quarter of those surveyed not doing so, an increase on the figures cited in the DfE’s 2013 Childcare and early years providers survey, which reported that 59 per cent of full day care settings and 48 per cent of sessional settings employed one or more graduate practitioner.
- Download the pdf Early Years Pay and Conditions Survey 2016
