
Let’s start with the positives. Remember just how much more freedom we have than we did this time last year. The contrast between the two maps based on anonymised Mobile App data are stark. The 2021 map (below) shows movement activity levels in the last week of March 2021 relative to pre-Covid (Early March 2020) for Central London.
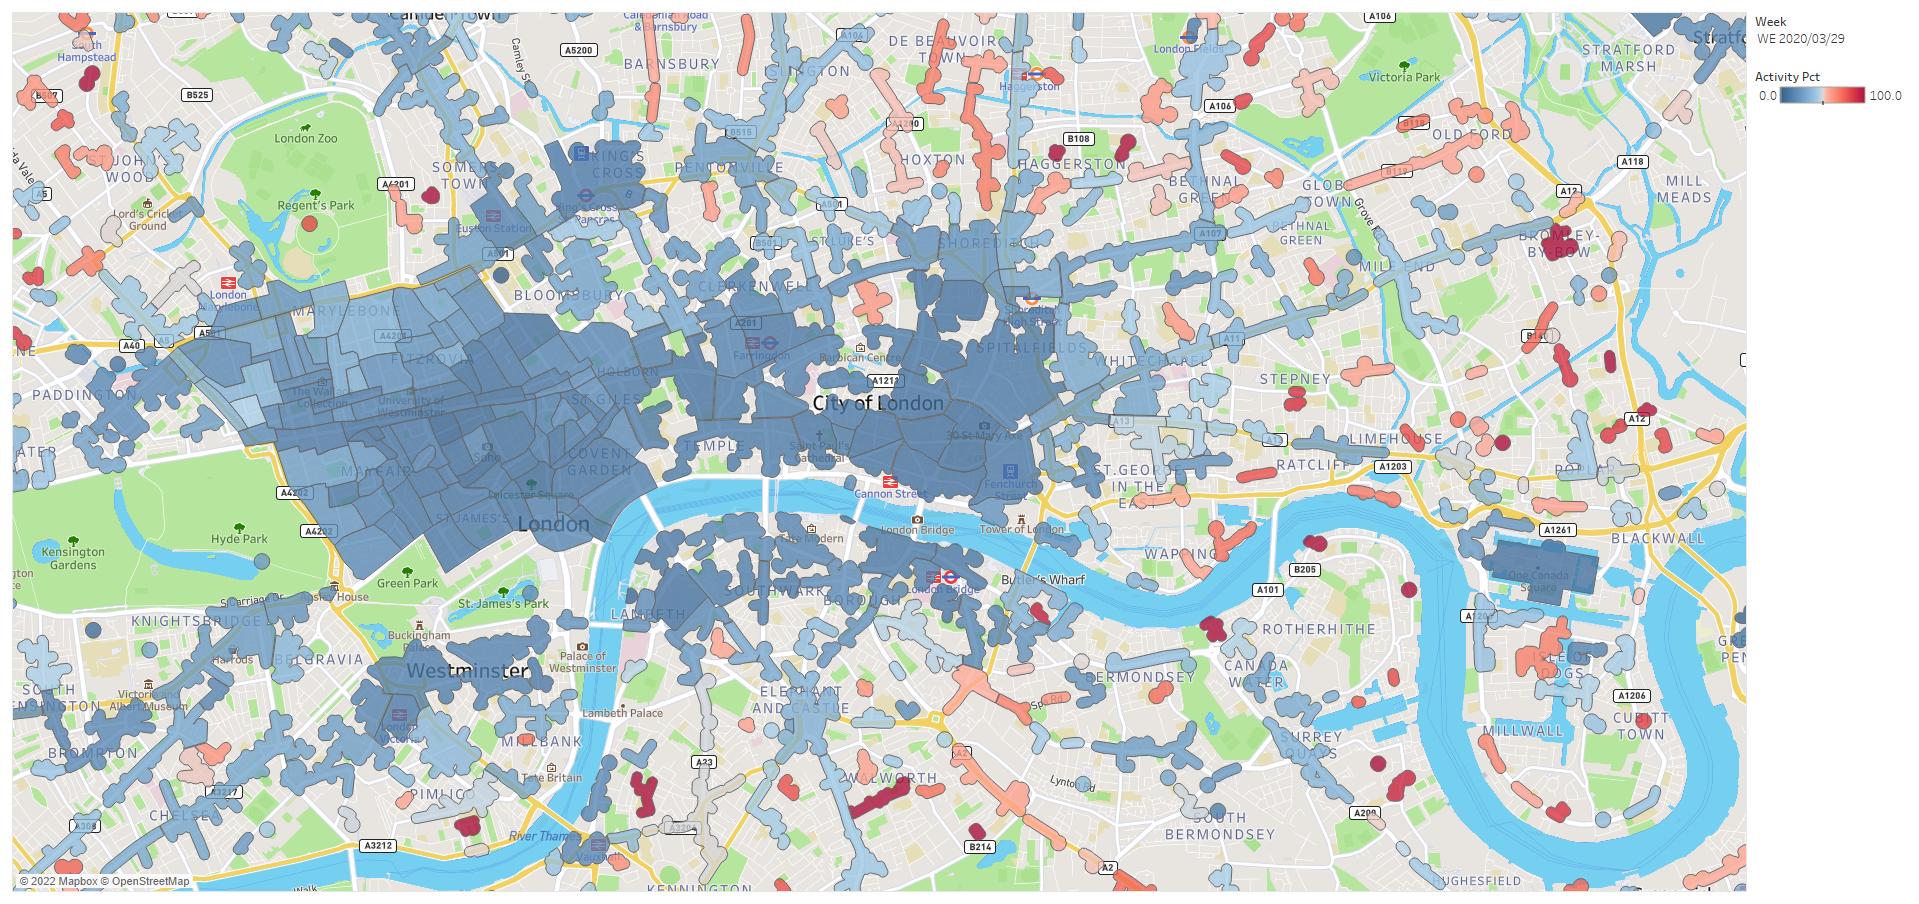
Dark blue shading shows areas that movement levels were way down on pre-pandemic across much of London – not surprising given that restrictions were really only lifted in early April 2021 for all but essential activities (albeit including trips to nurseries). The map below is the same week this year, and shows swathes of red across much of London, highlighting that activity and visits to many of these areas has returned to almost pre-Covid levels as we learn to live with life after Covid.
Register now to continue reading
Thank you for visiting Nursery World and making use of our archive of more than 35,000 expert features, subject guides, case studies and policy updates. Why not register today and enjoy the following great benefits:
What's included
-
Free access to 4 subscriber-only articles per month
-
Unlimited access to news and opinion
-
Email newsletter providing activity ideas, best practice and breaking news
Already have an account? Sign in here


